1. China Near-Surface Air Temperature/Precipitation Forecast
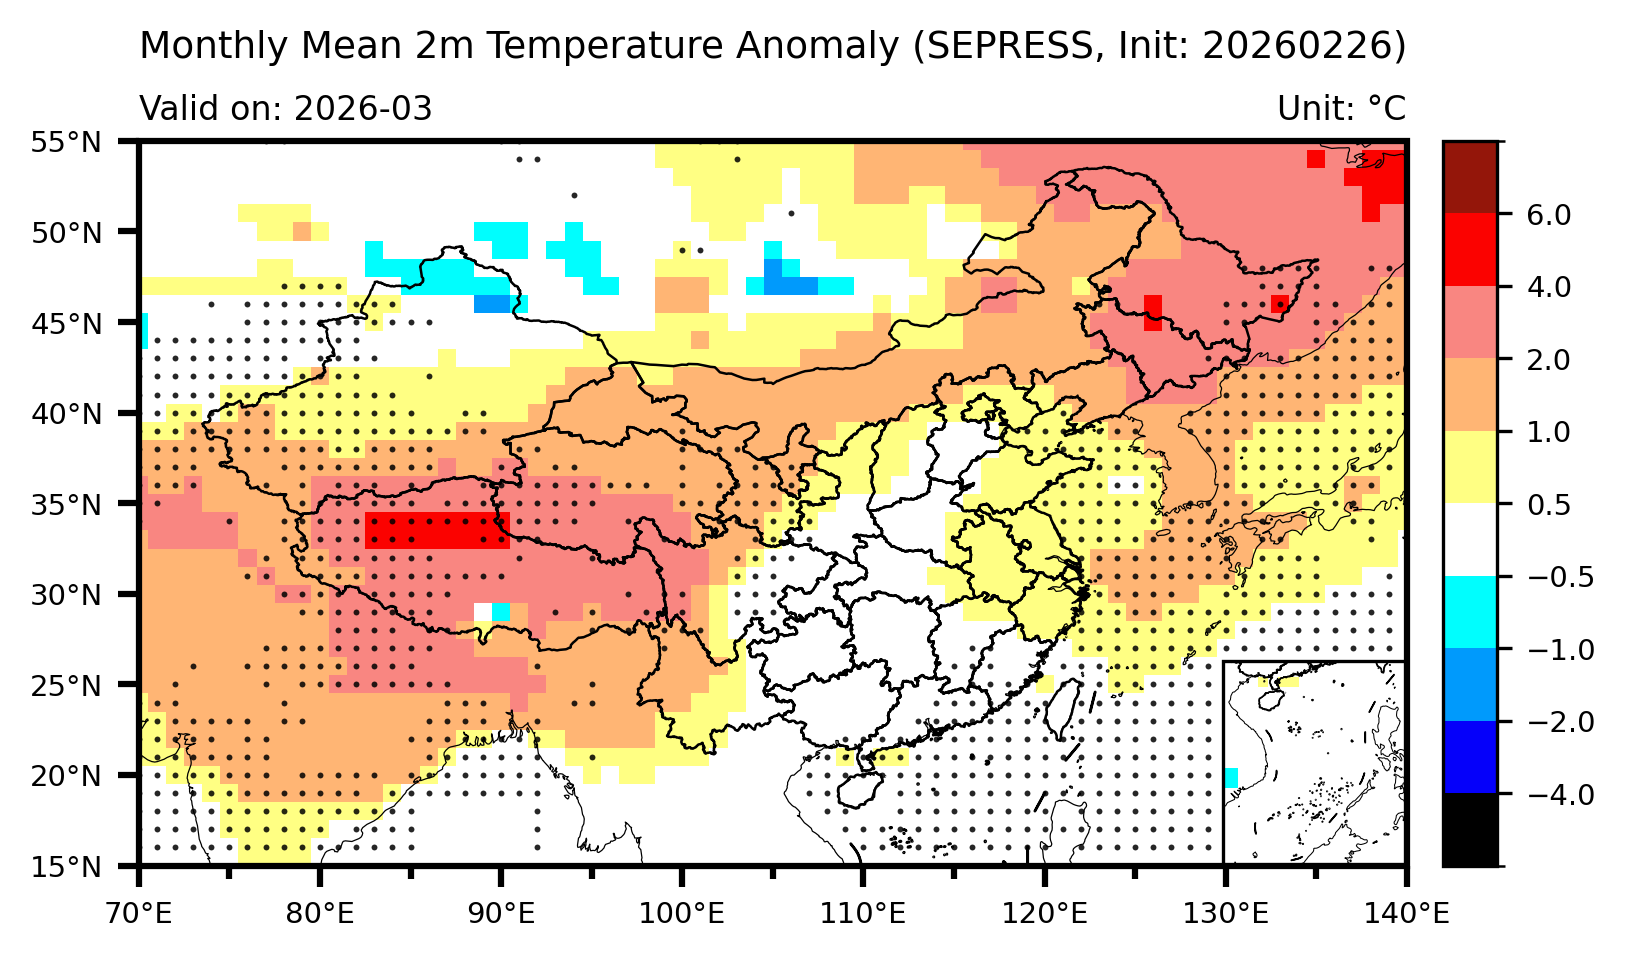
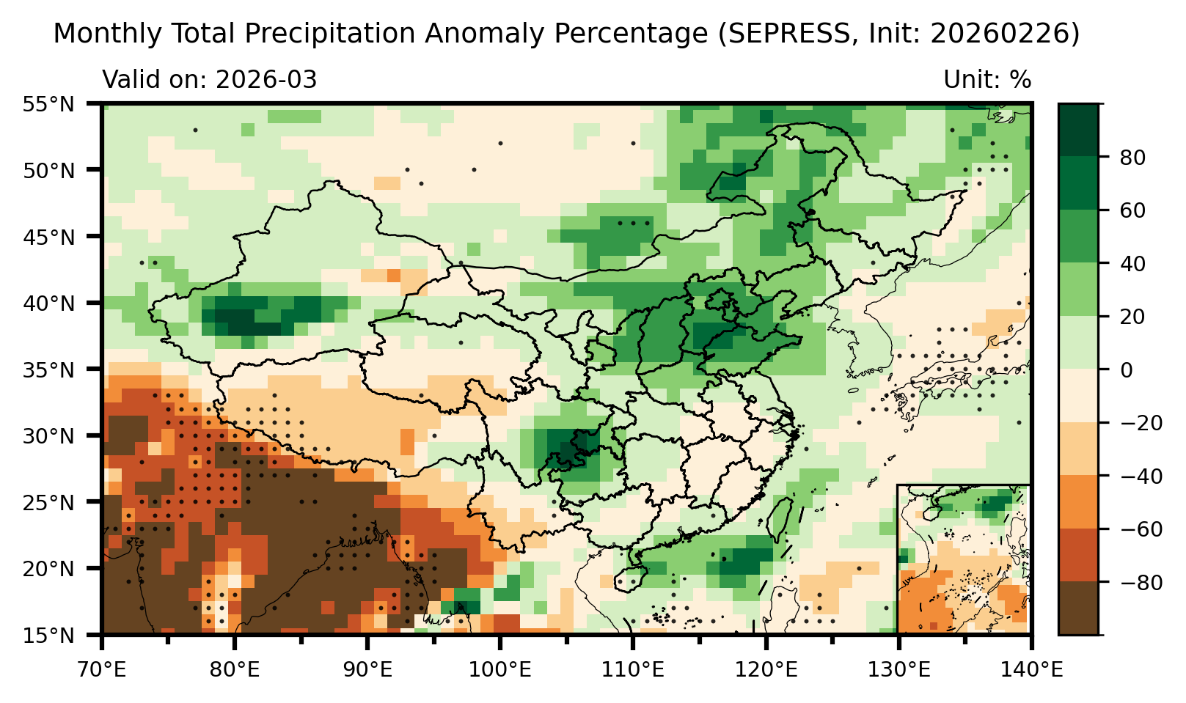
In March 2026, surface temperatures in China are generally above average, with the most significant temperature anomalies observed in the Northeast and Western regions. Temperatures in the three northeastern provinces, Inner Mongolia, Gansu, Tibet, southern Xinjiang, and western Sichuan and Yunnan are generally above 1°C, with areas in Tibet, Heilongjiang, and Jilin experiencing temperature increases of over 2°C, and some regions potentially exceeding 4°C. In contrast, temperatures in North China and the Huang-Huai region are close to normal or slightly warmer, while central and southern China maintain near-normal levels. Precipitation in China shows a “wet north, dry south, and significantly dry in the Qinghai-Tibet Plateau” distribution. Northern and central China receive 20-60% more rainfall than usual, with particularly notable increases in precipitation in central and eastern Inner Mongolia, northern Beijing-Tianjin-Hebei, southern Xinjiang, and the Sichuan Basin, where rainfall could increase by over 60%, and some areas may experience frequent strong precipitation events. In the Huang-Huai to the middle and lower Yangtze River regions, precipitation is slightly below average. In addition, most of the Qinghai-Tibet Plateau and southern Yunnan experience a 20-40% decrease in rainfall, with some areas receiving less than half of the usual precipitation, creating a high risk of meteorological drought. Close attention is recommended to agricultural production and water resource management. Overall, the north should be on guard for secondary disasters caused by snowmelt and strong precipitation events, while the southwest and parts of South China should focus on drought prevention and spring irrigation water security.
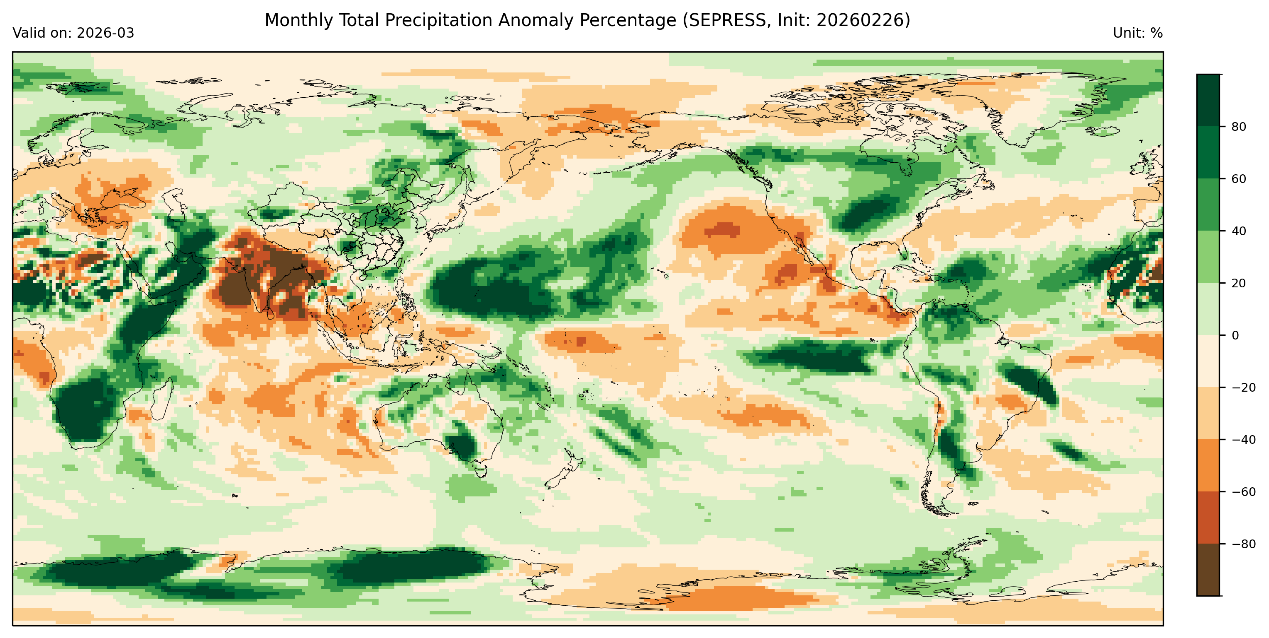
2. Global Near-Surface Air Temperature/Sea Surface Temperature/Precipitation Forecast
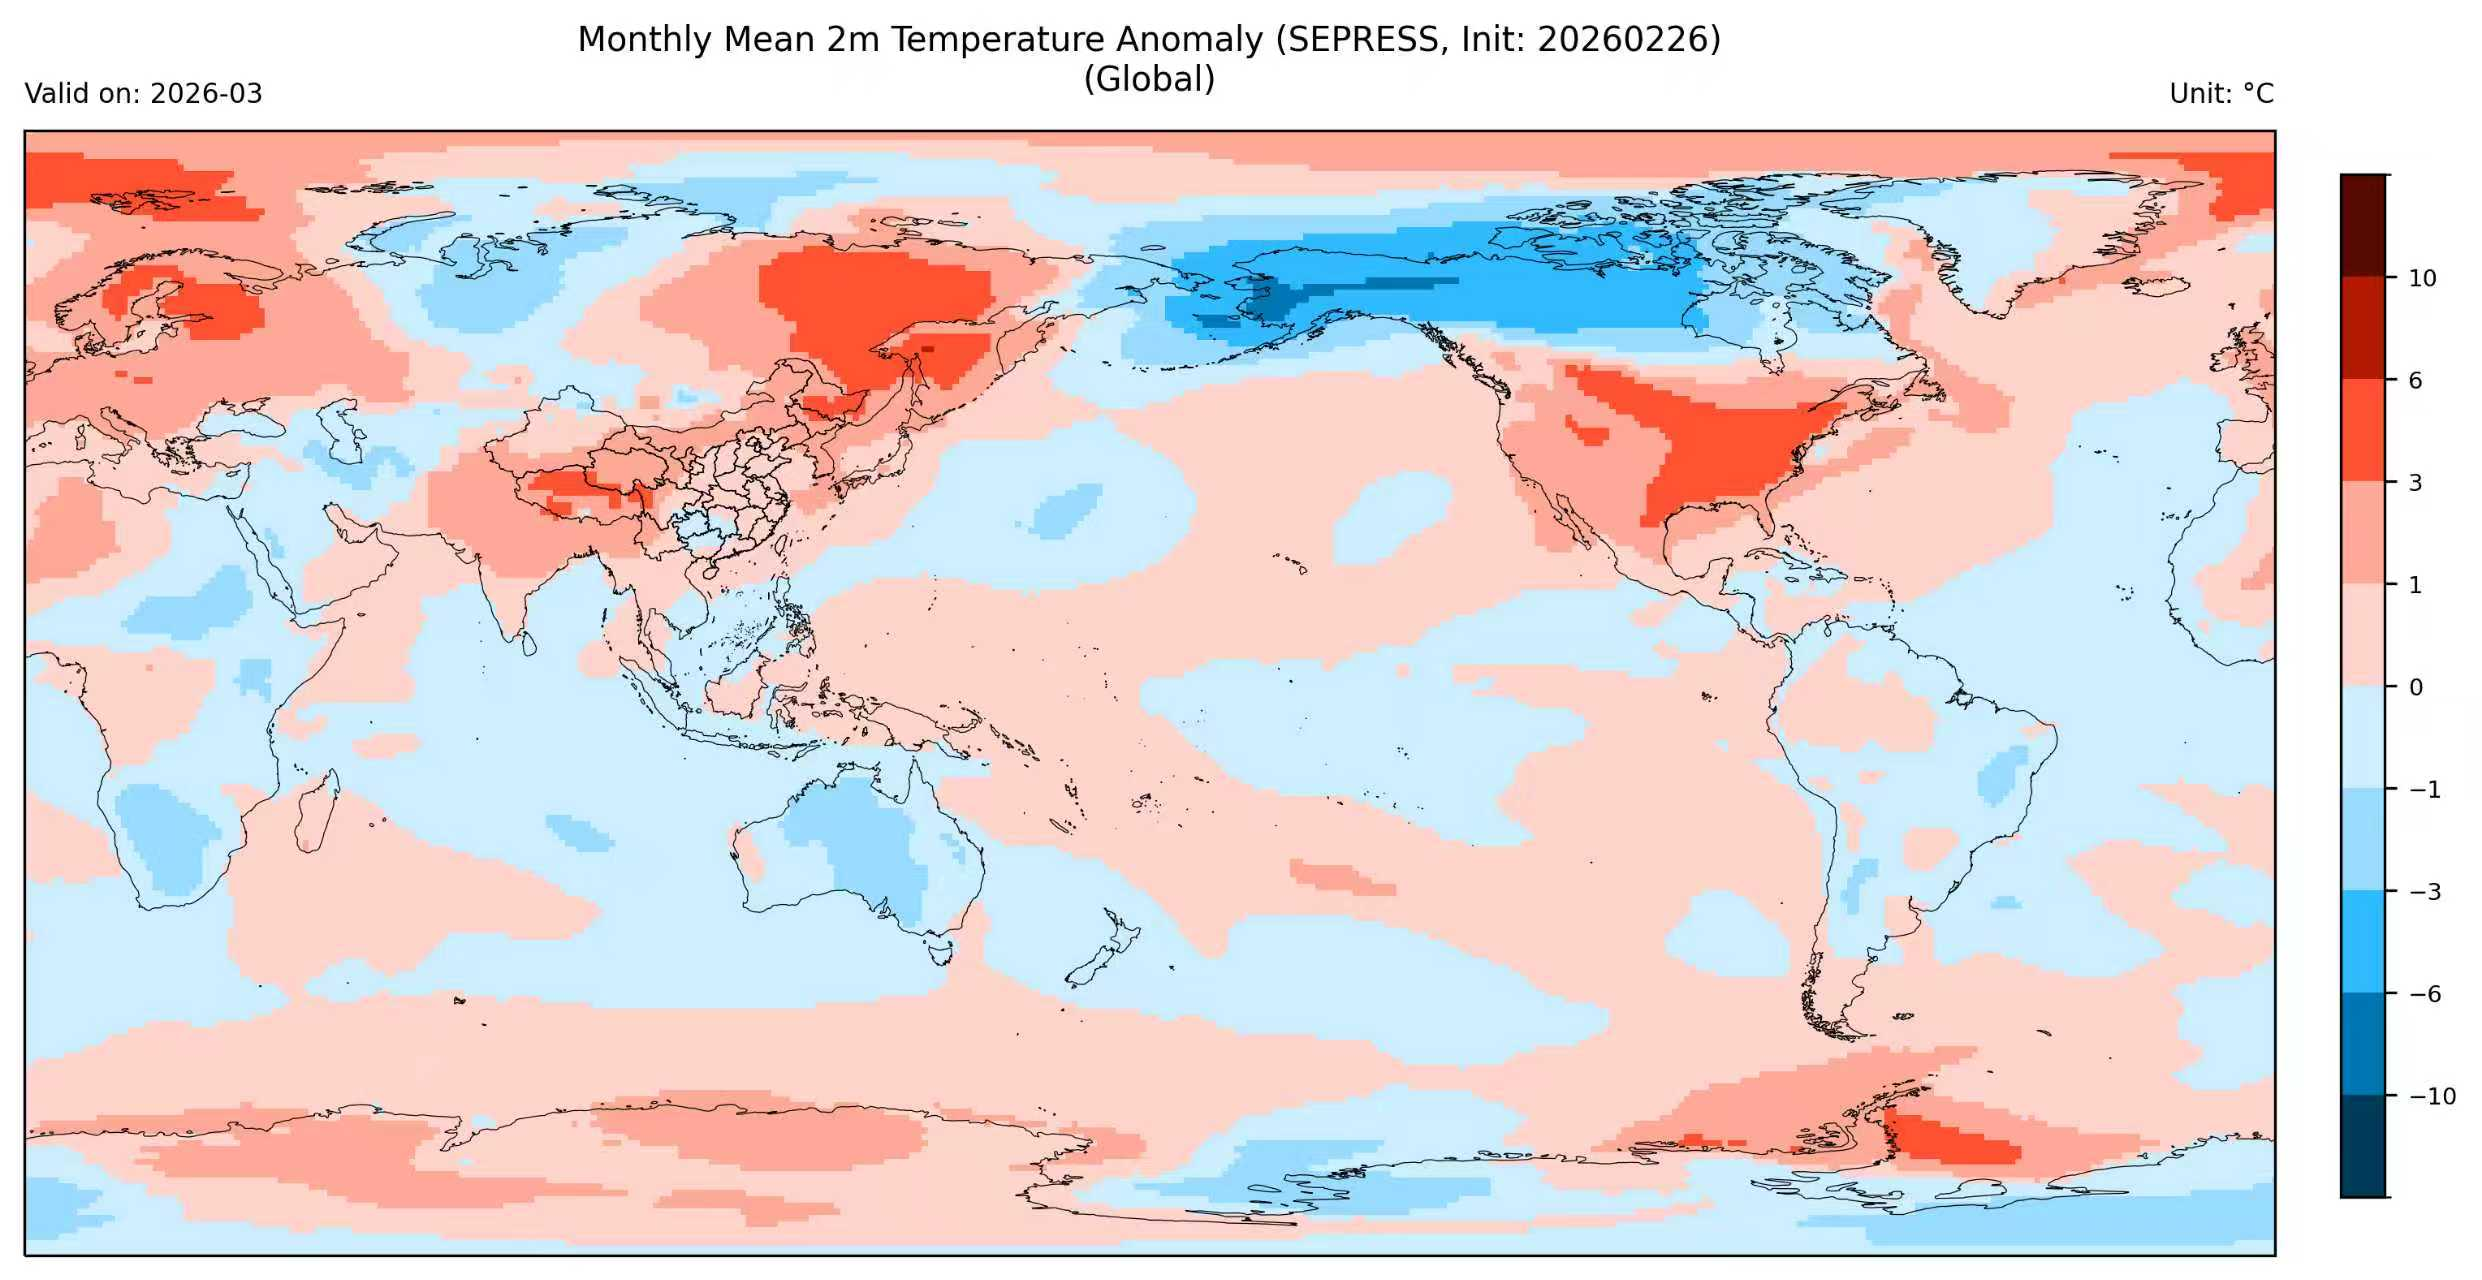
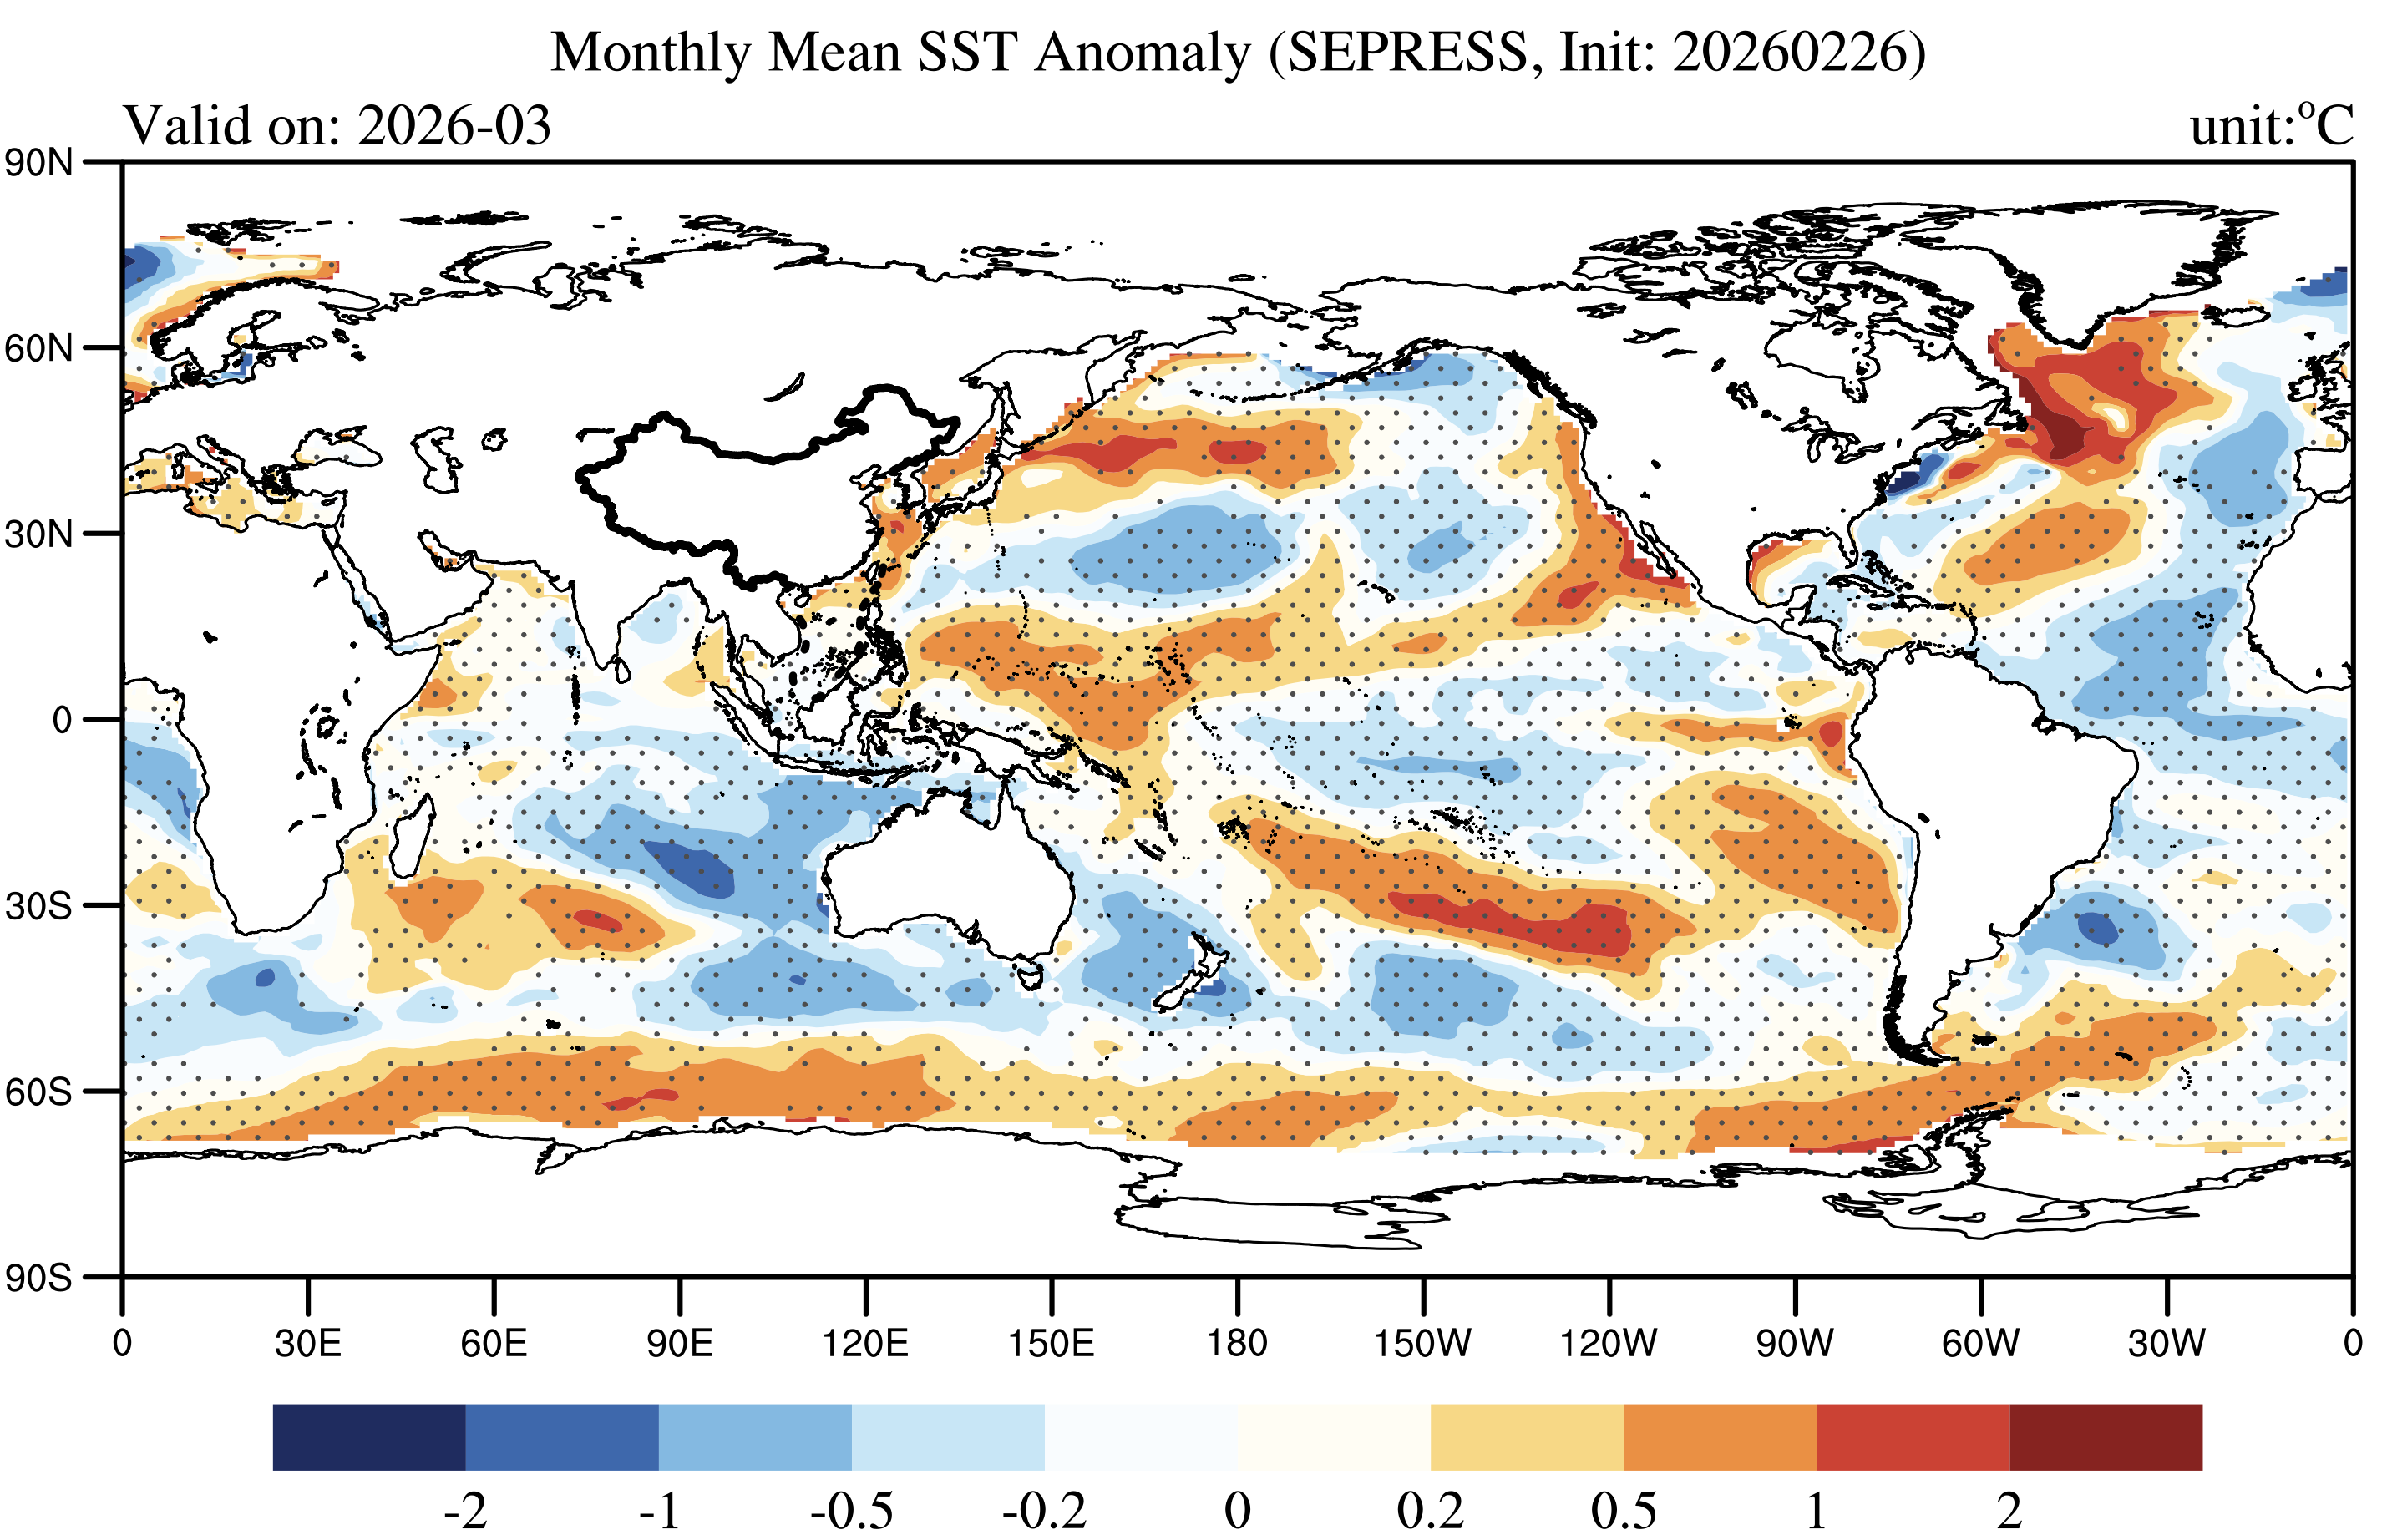
On a global scale, sea surface temperatures, near-surface air temperatures, and precipitation show that the “La Niña” phenomenon continues to weaken and undergo a phase transition. The equatorial eastern Pacific is expected to warm by about 0.5°C, while the central Pacific will maintain a negative anomaly of 0.2-0.5°C. The equatorial Walker circulation still shows a significant lag effect, leading to warmer sea temperatures and active convection in the northwest Pacific’s mid-latitudes, with precipitation exceeding 80% above average, while the northeast Pacific experiences 20-40% below-average precipitation. In the southern hemisphere, the subtropical Indian Ocean exhibits a positive dipole (SIOD+), affecting cross-equatorial flow and resulting in significantly wetter conditions in the western Indian Ocean, South Africa, East Africa, and the Arabian Peninsula, with precipitation over 80% above average. In contrast, the Indian subcontinent and the eastern Arabian Sea show extreme dryness with precipitation reductions exceeding 80%. Meanwhile, the northern hemisphere exhibits strong regional temperature contrasts, with the Eurasian continent showing a distinct meridional “warm-cold-warm” tripole structure and North America experiencing sharp latitudinal temperature differences, with Alaska and northern North America experiencing temperatures 2-4°C below normal, while most of the mid-latitudes are 2-4°C warmer. These temperature differences may indicate the continued active state of the northern hemisphere’s early spring polar vortex and blocking high-pressure systems. It is important to closely monitor how the global anomalous circulation patterns will affect future climate trends, particularly the onset of China’s rainy season.
3. Global Atmospheric Rivers Forecast
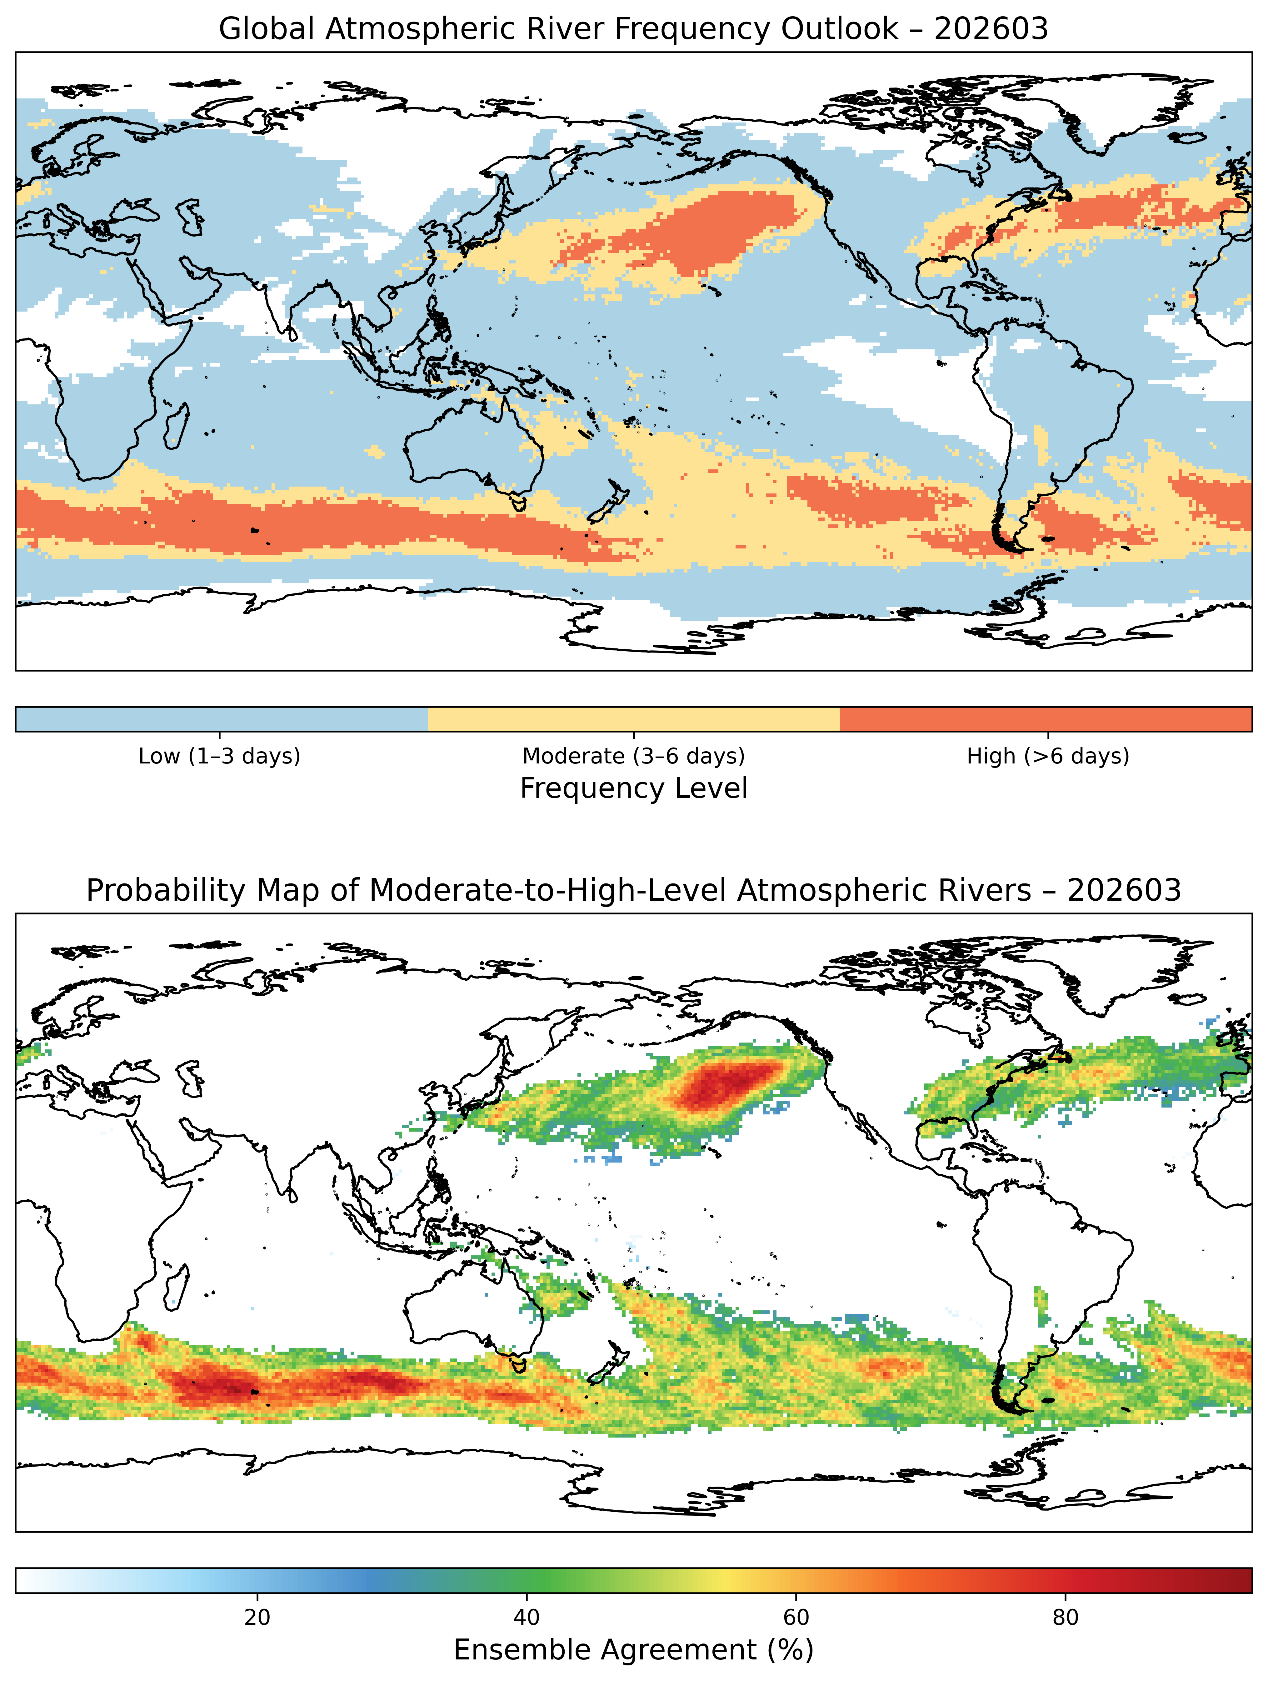
Using the PanLu2.0 Atmospheric River Identification and Tracking Algorithm developed by our team, March 2026 atmospheric river (AR) activity has been globally identified. Based on global distribution predictions, the west coast of Canada and the east coast of the United States have a high probability of experiencing high-level atmospheric rivers in March, with strong consistency across model ensemble. Considering the global precipitation anomaly map and atmospheric river frequency map, special attention should be given to the potential disasters caused by persistent heavy rainfall (or snowfall) from storms in Canada and the eastern United States, as well as their impact on transportation.
These forecasts are derived from the objective prediction methods of the SEPRESS team. The associated products represent scientific and technological outcomes intended for technical reference in disaster prevention and mitigation efforts. They should not be used as the sole basis for decision-making. Further tracking and updated forecasts are strongly recommended.
——————————
The above monthly TC outlook is based on the SEPRESS Global Climate Seamless Prediction System. SEPRESS, or Seamless Prediction and Services for Sustainable Natural and Built Environments, is a global initiative led by the Hong Kong University of Science and Technology (HKUST) that translates scientific advancements in weather-to-climate (or, subseasonal-to-seasonal) prediction into practical, tailored solutions to enhance global climate resilience and sustainability. The initiative, endorsed by UNESCO, aims to bridge the gap between science and society by fostering partnerships and delivering actionable outcomes to support the UN’s Sustainable Development Goals. The SEPRESS team comprises hydrometeorologists and modelers from the HKUST, the Institute of Atmospheric Physics (Chinese Academy of Sciences), and Beijing Normal University.
Text and Figures contributed by: LIU Can, SONG Yurong, LI Shentong, LIU Anling, TANG Yao